

Oil сonsumption. Data by country and region from 1965 to 2023.
List
Visualization
Source:
Energy institute,
![]() Statistical Review of World Energy BP
Statistical Review of World Energy BP

Energy institute
https://www.energyinst.org/
https://www.energyinst.org/
Statistical Review of World Energy BP
https://www.bp.com/en/global/corporate/energy-economics/statistical-review-of-world-energy.html
https://www.bp.com/en/global/corporate/energy-economics/statistical-review-of-world-energy.html
Total: 101,85 mln barrels daily
Countries: 215
Basic data
Change
from
to
Per 100,000 inhabitants
Per 100,000 km2 area
Tons per year
Percent of production
Oil consumption/Gas consumption
Flag
barrels daily


Netherlands Antilles
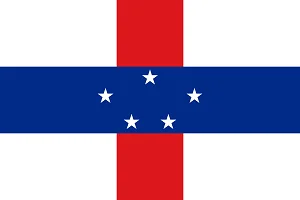
47 363
107


Minor Outlying Islands US

1 999
197


Falkland Islands

247
211

Antarctica
79
214
Column
Treemap
Map
Piechart
Racechart
