Data and statistics you can trust
Over 1,000,000 datasets for 200+ countries and regions
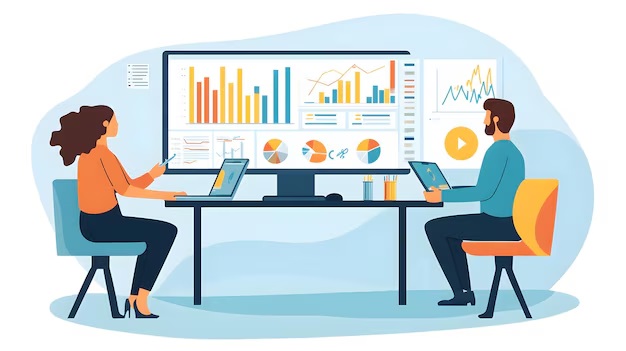
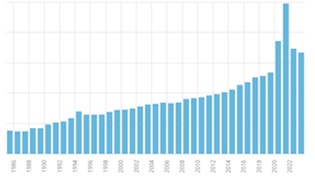
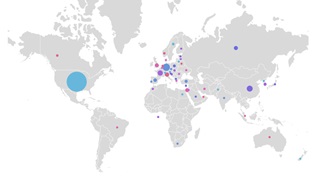
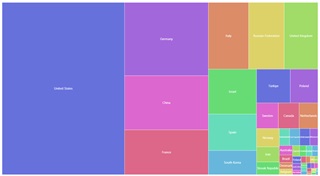
Data visualization
Our visualization will give a better understanding
Popular datasets
Our visualization will give a better understanding
GDP (IMF data)
GDP per capita
Commodity prices
Number of adults by wealth group
Total wealth of billionaires
Export with details by product
Oil production
Natural gas exports
Electricity installed capacity, by source
Mineral and metal reserves
Military expenditure
Vehicle sales by brand
Real house price change
Number of intentional homicides
Number of rapes per 100,000 population
Inbound tourism arrivals
Digital competitiveness ranking
Henley passport index

The information is now even closer
All data is available in the mobile app
Our mobile application provides instant access to a huge amount of information on country, regional and association indicators.
300,000+
datasets
200+
countries
350+
indicators
1,000,000+
graphics


